
柱状图
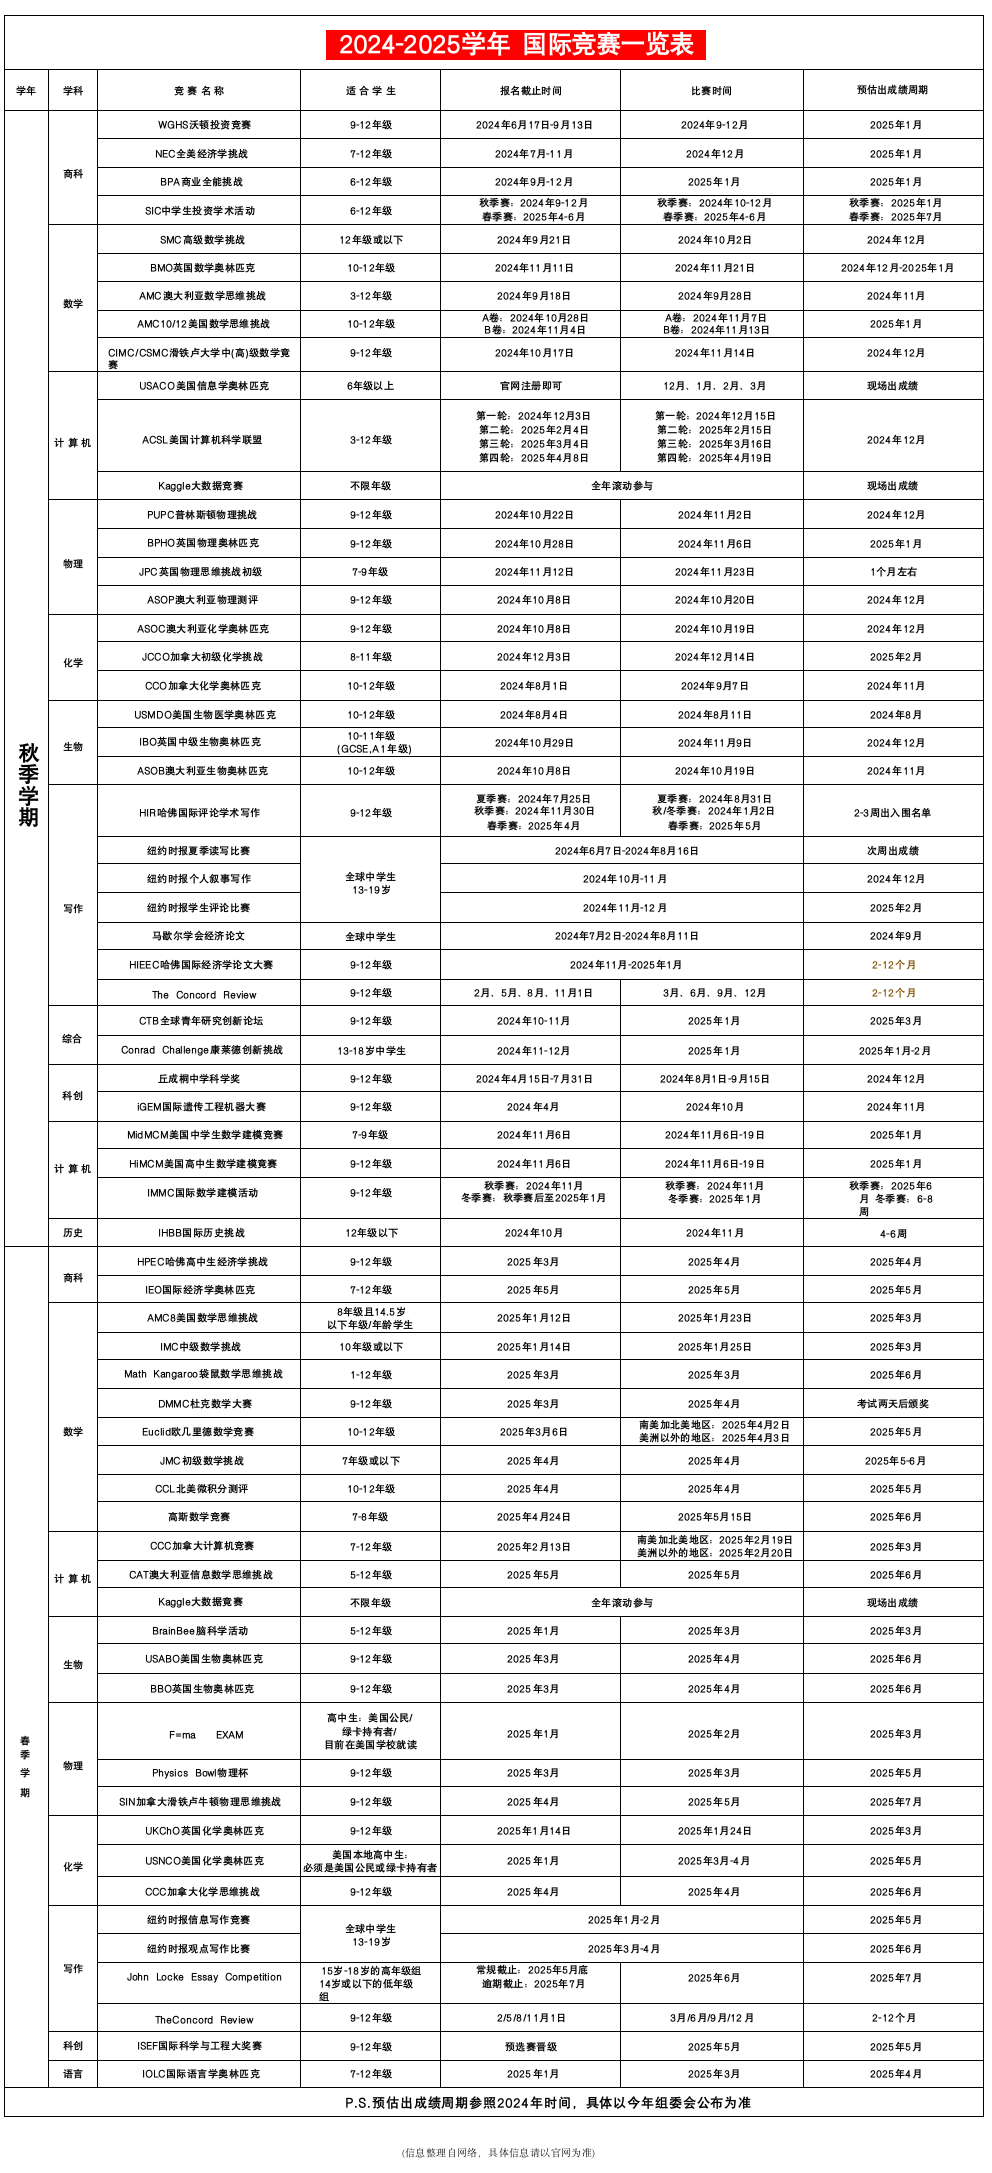
The chart below shows information about fuel used in the transport sector in different countries in Europe, compared to the EU average, in 2009 and 2010.
Summarise the information by selecting and reporting the main features, and make comparisons where relevant.

题目来源:2025年4月12日大陆雅思小作文
1、题目大意
该图显示了2009年和2010年欧洲不同国家运输部门使用的燃料信息,以及与欧盟平均水平相比。
2、高分范文示例
开始段 - 改写题目+总结
The bar chart illustrates the fuel consumption of the transportation sector in six European countries—Slovakia, Italy, France, Austria, Spain, and Greece—in 2009 and 2010, compared to the European Union average. Overall, Slovakia consistently had the highest fuel consumption, significantly exceeding the EU average, whereas the other five countries' fuel usage was either close to or below this average.
第一段 - 下降的国家
As shown, fuel consumption in transportation notably decreased in Slovakia, Spain, and the European Union average. In 2009, Slovakia had the highest fuel consumption among the six countries, nearly 9%. Although this figure fell to 6.5% in 2010, it still remained above the European average of 6%. Spain experienced a decline from just below 4% in 2009 to 3% in 2010, while the EU average also decreased by 1%, from 6% to 5%.
第二段 -上升和持平的国家
In contrast, Austria's fuel usage remained stable at slightly over 5%, whereas Italy, France, and Greece all recorded increases. Italy's fuel consumption rose from 4.5% in 2009 to 5.1% in 2010, surpassing the EU average and equaling Austria's figure. France's consumption increased from under 4% to approximately 4.5%, while Greece's usage doubled from around 1% to 2%, although it still remained the lowest among the six countries.
必备语料
fuel consumption 燃料消耗量
transportation sector 运输部门
exceeded the average 超过平均水平
experienced a decline 经历下降
remained stable 保持稳定
recorded increases 出现增长
surpassed the EU average 超过欧盟平均水平
significantly higher than 显著高于
fell to 下降到
the lowest among 在……中最低
【竞赛报名/项目咨询+微信:mollywei007】